Decoding the Smile: What Machine Learning Taught Us About Global Happiness
The pursuit of happiness is one of humanity's oldest philosophical questions. But in the era of big data, it has also become a statistical one. The 2015 World Happiness Report provided a fascinating snapshot of global well-being, ranking 158 countries based on complex survey data. But what truly drives these scores? Is it purely wealth, or do health, family, and freedom play a larger role?
To answer this, I utilized Python and machine learning to reverse-engineer the happiness score. By analyzing six key metrics—Economy (GDP per Capita), Family, Health (Life Expectancy), Freedom, Trust in Government, and Generosity—this project aims to find the mathematical equation for a happy nation.
1. The Data and Its Significance
The dataset spans the globe, from the pristine peaks of Switzerland (Rank 1, Score 7.587) to the challenging environments of Togo (Rank 158, Score 2.839). This variance provides a perfect playground for regression analysis. Before building any models, we mapped the correlation between the variables.
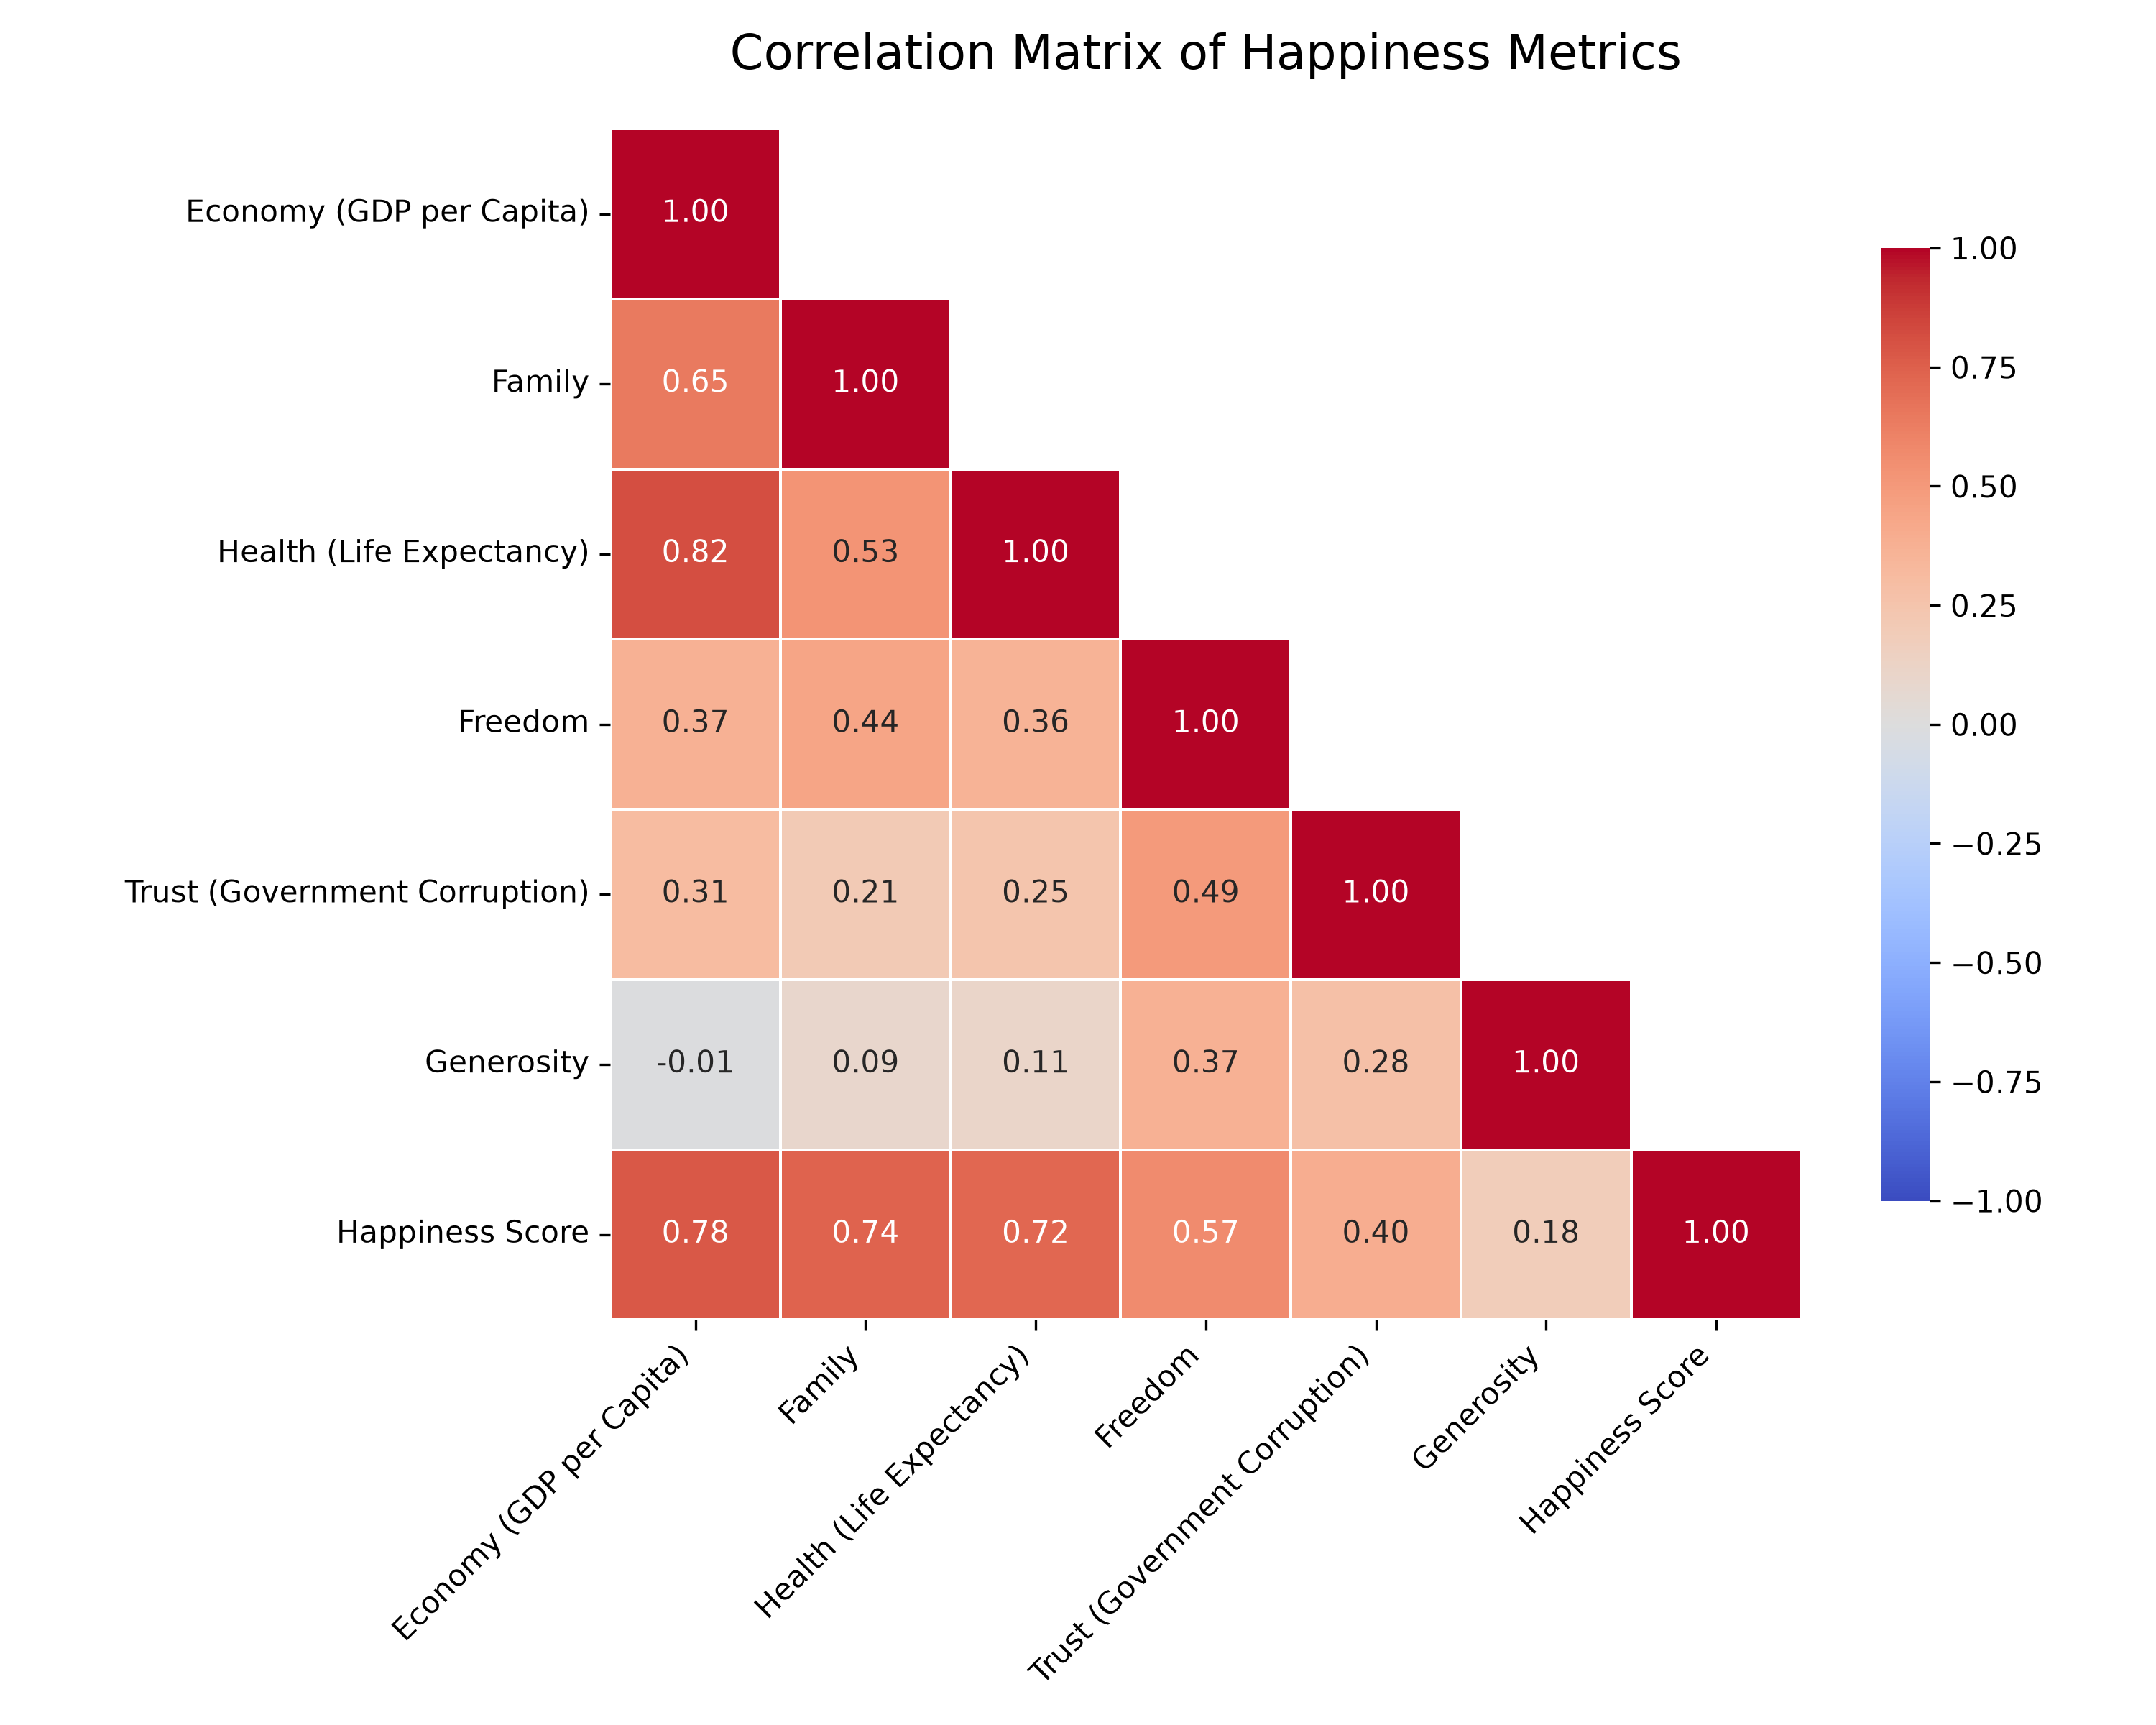
As seen in the heatmap above, the strongest positive correlations with the Happiness Score are Economy (GDP) and Health. Interestingly, Generosity shows a surprisingly weak correlation. This immediately tells us that while giving to charity feels good, a nation's average generosity doesn't dictate its overall happiness ranking as strongly as its wealth or life expectancy.
2. The Machine Learning Showdown
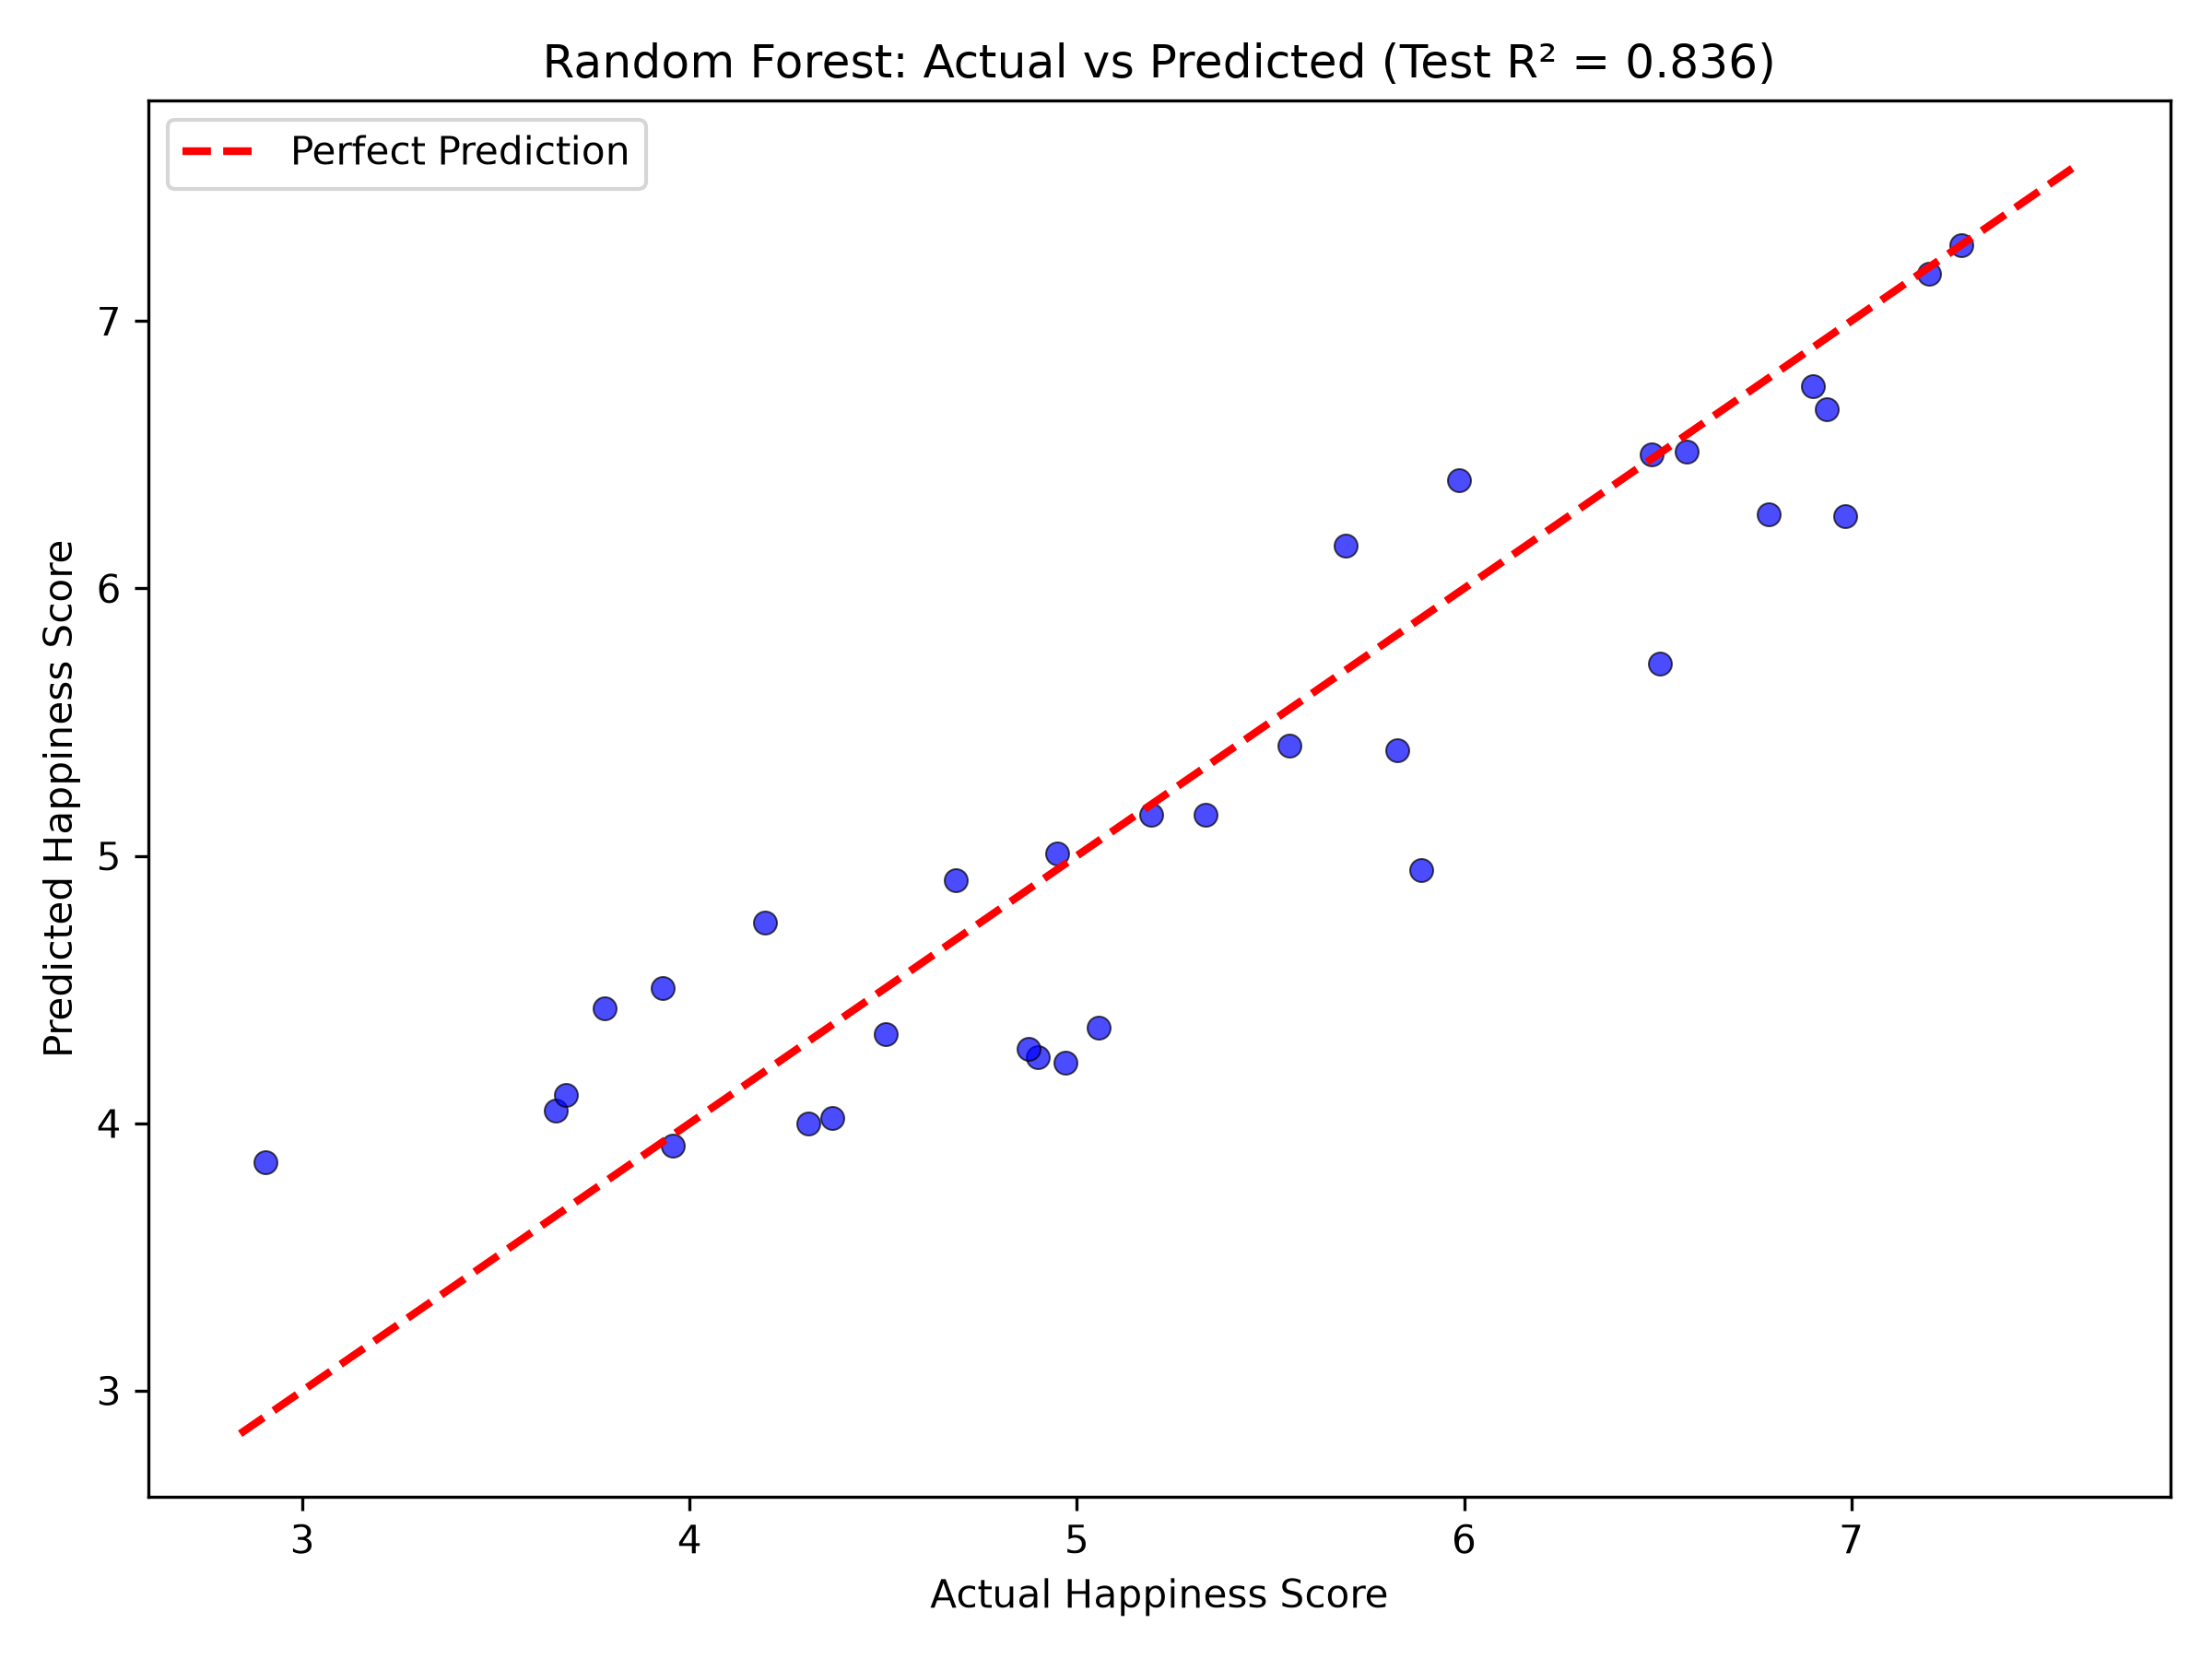
We trained four distinct machine learning models on 80% of the data and tested them on the remaining 20% of unseen countries. The metric used to judge them was the R-squared (R²) score. In simple terms, R² tells us the percentage of the variance in happiness that our model can explain. An R² of 1.0 is perfect; an R² of 0 means the model is just guessing the average.
| Model | Train R² | Test R² | Average Error (MAE) |
|---|---|---|---|
| Linear Regression | 0.803 | 0.864 | 0.348 |
| Random Forest | 0.966 | 0.836 | 0.392 |
| XGBoost | 1.000 | 0.796 | 0.432 |
| Decision Tree | 0.920 | 0.758 | 0.478 |
3. Extracting the Formula for Happiness
Because Linear Regression is a "white box" model, we can extract the exact mathematical coefficients it learned. These coefficients tell us exactly how much a 1-unit increase in a feature affects the Happiness Score, assuming everything else stays the same.
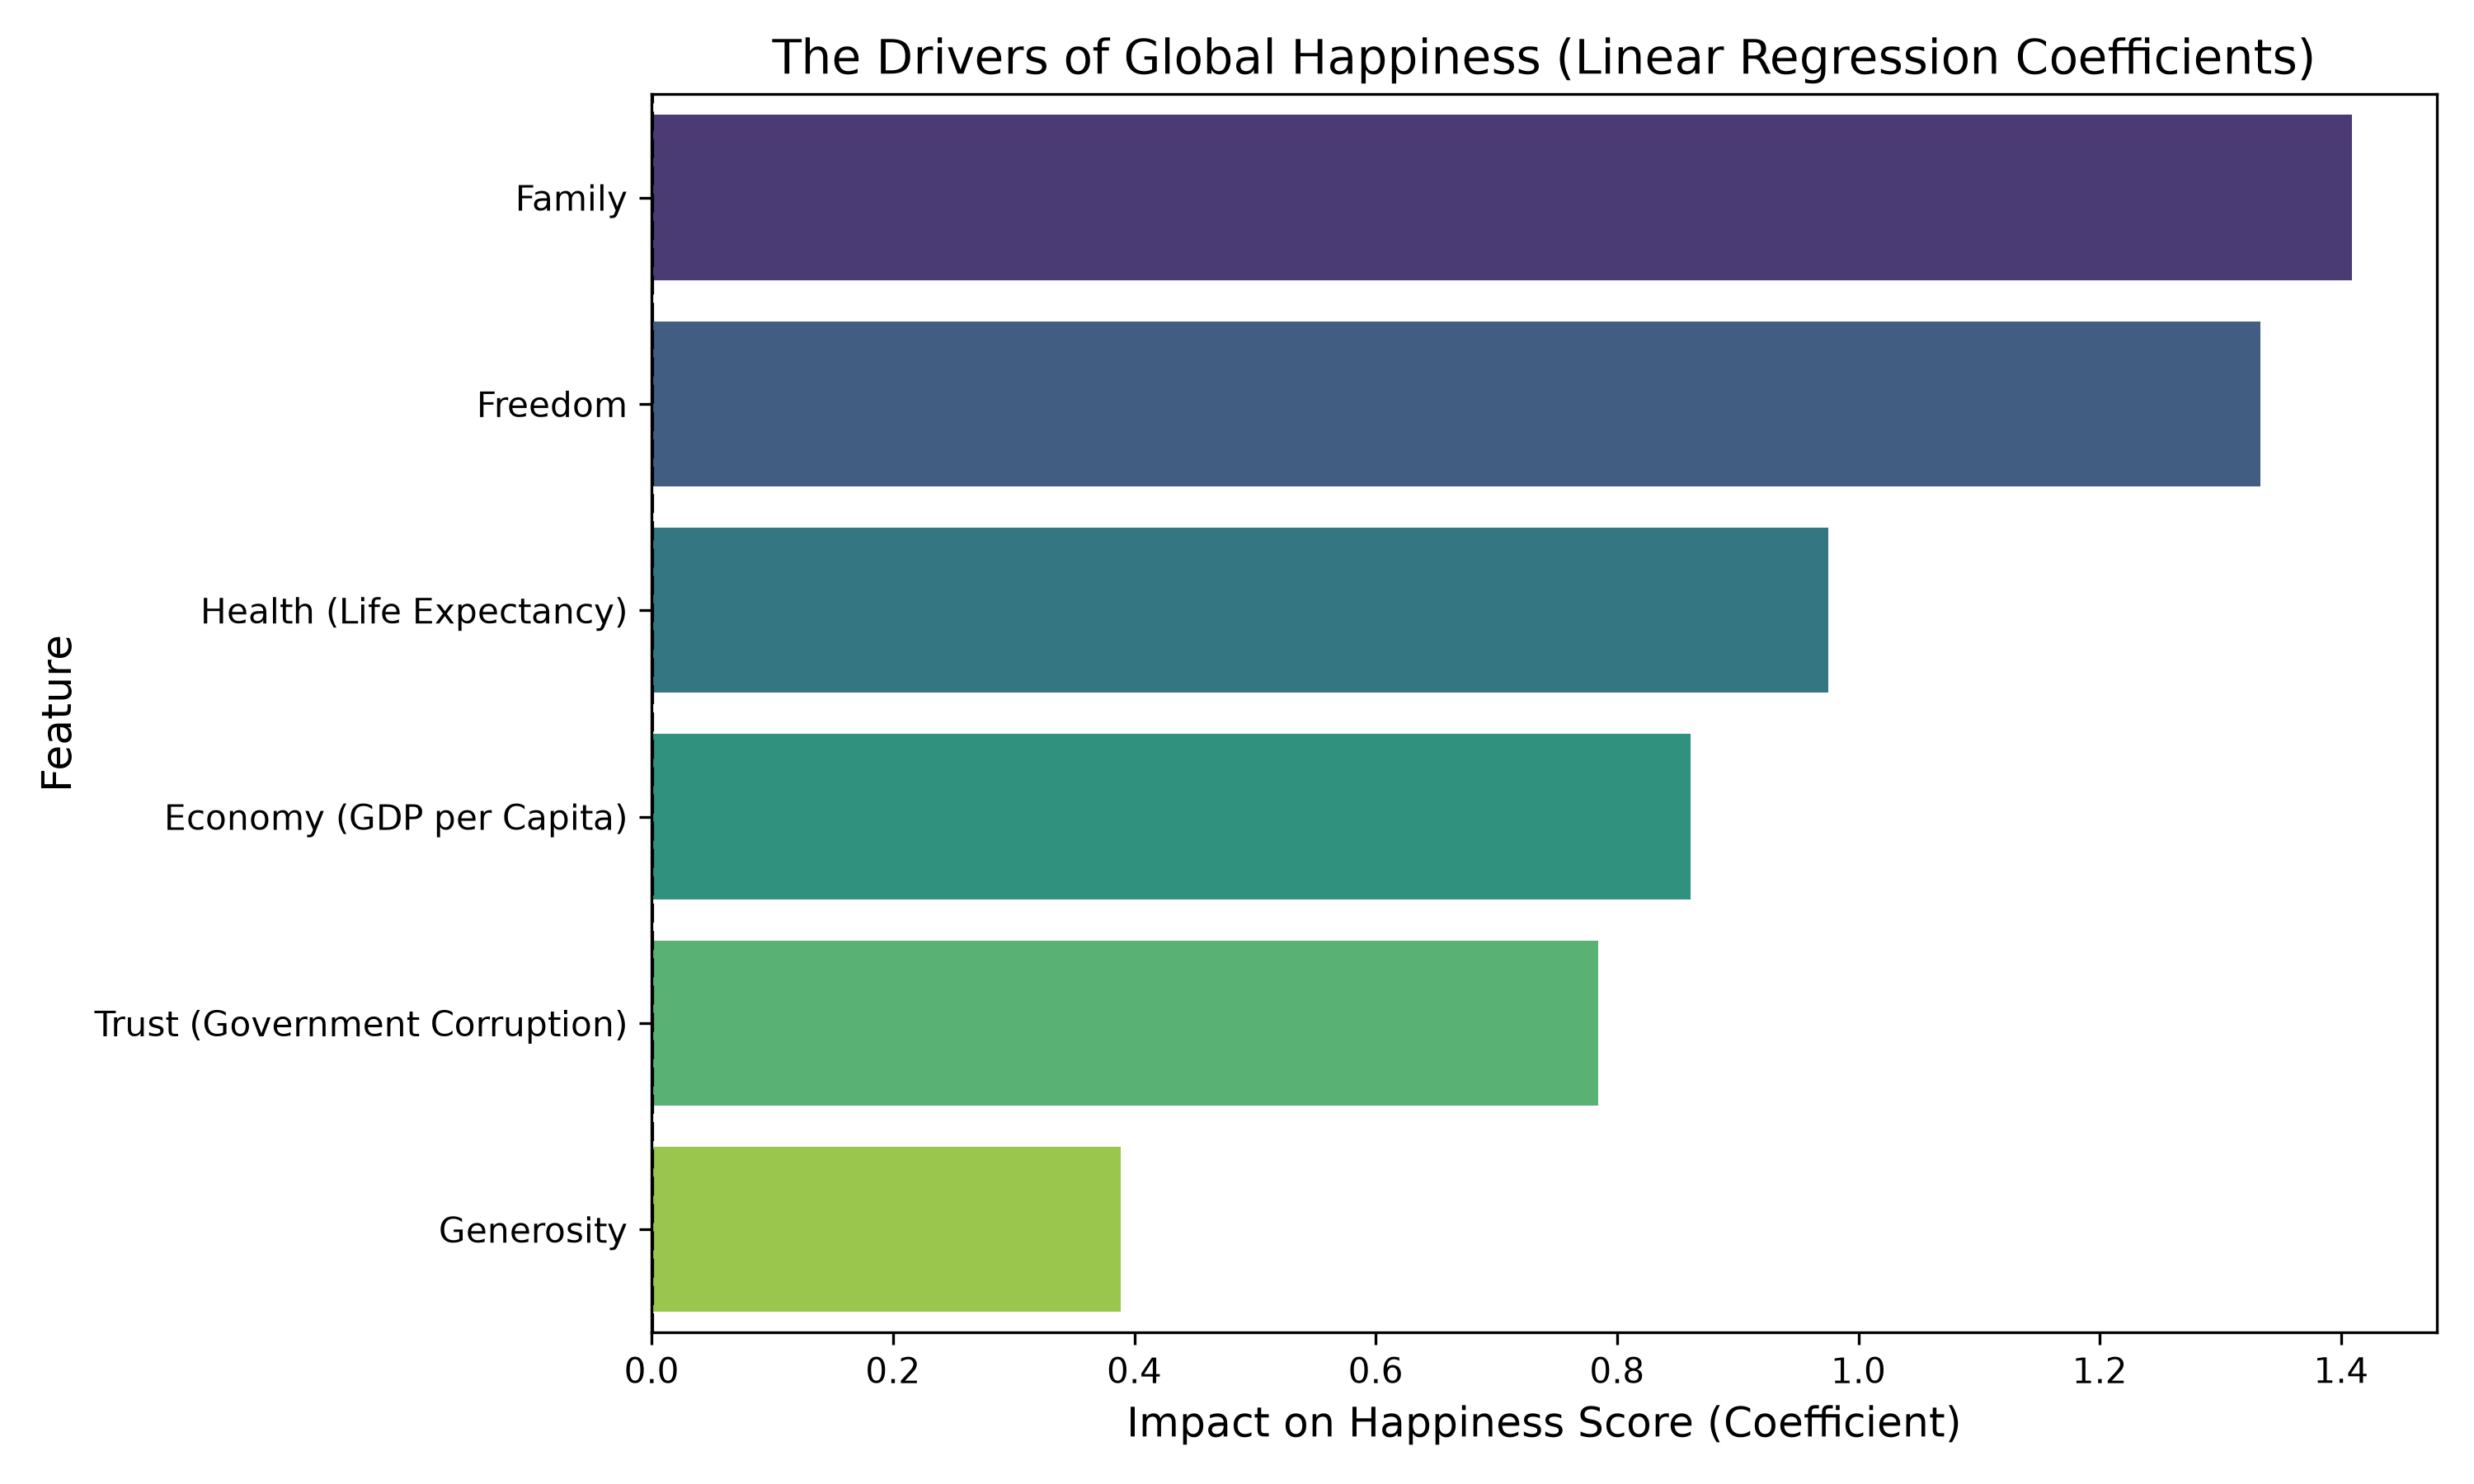
The Economic Weight: Economy (GDP per Capita) has the largest coefficient. In our model, a 1-point increase in the GDP metric translates to roughly a 1.2-point increase in the happiness score. Money, unequivocally, matters.
The Health Factor: Health (Life Expectancy) comes in second. A healthy population is a happy population.
The Generosity Paradox: Look at the Generosity bar. It is practically invisible. Mathematically, whether a country scores high or low on generosity barely shifts the needle on its overall happiness ranking, at least when compared to the heavyweights of GDP and Health.
4. Classifying the World (And Why It's Hard)
Finally, we challenged the model to categorize countries into three distinct buckets: Low Happiness (score < 4.5), Medium (4.5 - 6.0), and High (> 6.0). We used a Random Forest Classifier for this task, and it achieved a 56% accuracy. At first glance, 56% seems low. But when we look at which countries it got wrong, a fascinating story emerges.
| Country | Actual Score | Actual Category | Model's Prediction |
|---|---|---|---|
| Italy | 5.948 | Medium | ❌ High |
| Venezuela | 6.810 | High | ❌ Medium |
| Switzerland | 7.587 | High | ✅ High |
Why did it fail on Italy and Venezuela? Look at their scores: 5.948 and 6.810. The model struggled because the boundaries between "Low" and "Medium" or "Medium" and "High" are entirely artificial. A country with a score of 5.99 is statistically almost identical to one with a score of 6.01, yet our rigid categories force them into different boxes. This highlights a crucial lesson in data science: sometimes regression is better than classification. Predicting the exact continuous score is much more natural than forcing human well-being into strict boxes.
Conclusion
Through this analysis, we proved that predicting the happiness of a nation is not random. The data shows a highly linear and predictable pattern. While complex AI models are tempting to use, the simplest model (Linear Regression) provided the most robust and interpretable results. Ultimately, the data suggests that the core pillars of a happy society remain fundamental: a strong economy, a healthy population, and strong familial bonds.